

Introduction
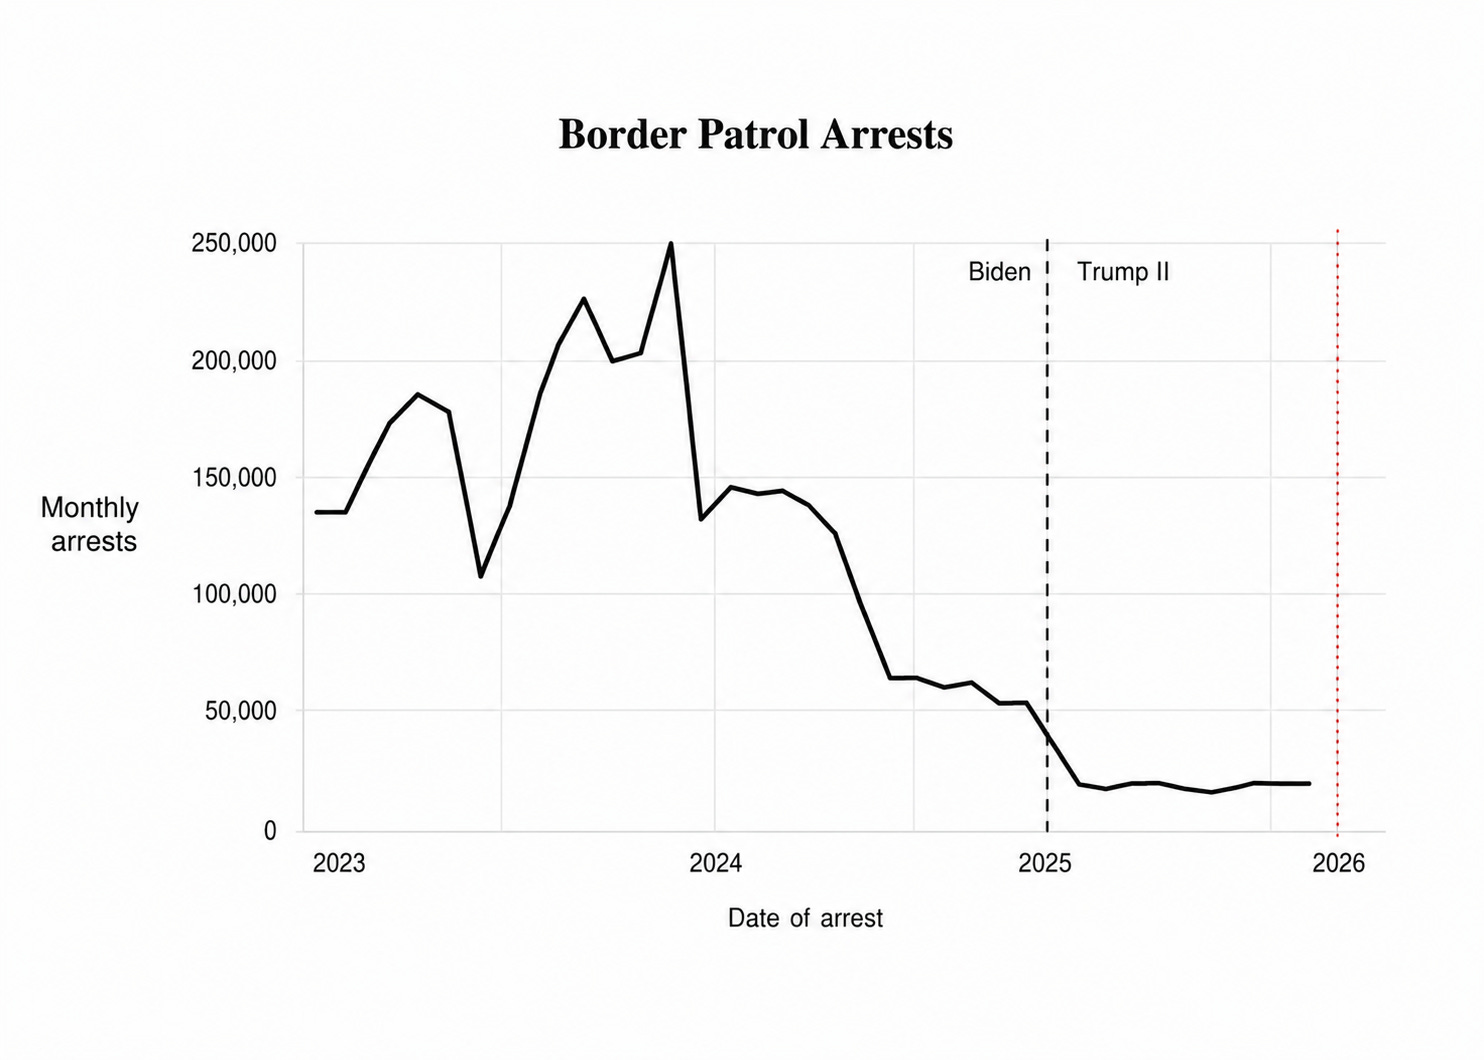
Immigration enforcement inside the United States changed dramatically during the first year of the second Trump administration. While border apprehensions declined sharply, ICE increasingly shifted its focus and resources toward interior enforcement within the United States. Compared with the average month during the second half of 2024, ICE arrests resulting in detention increased 4.4 times by January 2026, while interior deportations increased approximately fivefold. Street arrests rose by about 11 times, and arrests of people without criminal convictions increased 8.7 times.
At the same time, detention capacity expanded significantly while releases from detention declined, resulting in substantially more deportations following arrest.
This article examines immigration enforcement within the United States, separate from border enforcement, based on data obtained by the Deportation Data Project from U.S. Immigration and Customs Enforcement (ICE) through litigation over a Freedom of Information Act request.
The report shows that the sharp increase in interior deportations resulted from two major changes. ICE greatly expanded arrests, particularly street arrests and arrests of people without criminal convictions. At the same time, detention policies changed, making release while awaiting immigration proceedings far less common.
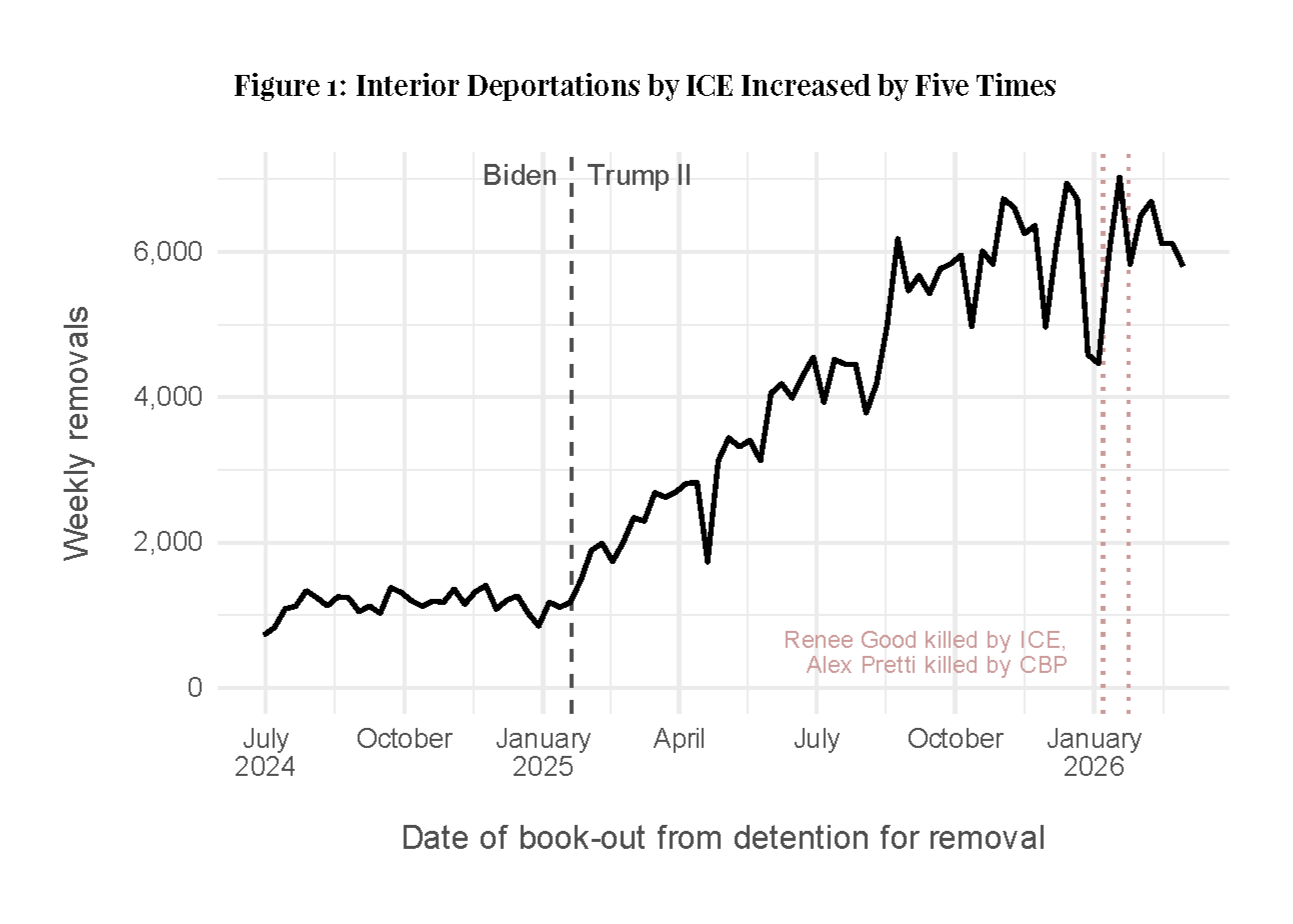
Interior Deportations Increased by Five Times
In January 2026, interior deportations following ICE arrest and detention increased more than fivefold compared with the average month during the second half of 2024. This measure focuses on deportations that began with an ICE arrest inside the U.S., rather than enforcement at the border, allowing the report to distinguish increased immigration enforcement away from the border from the simultaneous decline in border enforcement.
The report identifies two primary factors behind the increase in interior deportations: a substantial increase in ICE arrests and detention policies that made release while awaiting immigration proceedings far less common.
Figure 1 illustrates the fivefold increase in interior deportations following ICE arrest and detention, highlighting the expansion of immigration enforcement during the study period.
More Arrests, Especially Street Arrests
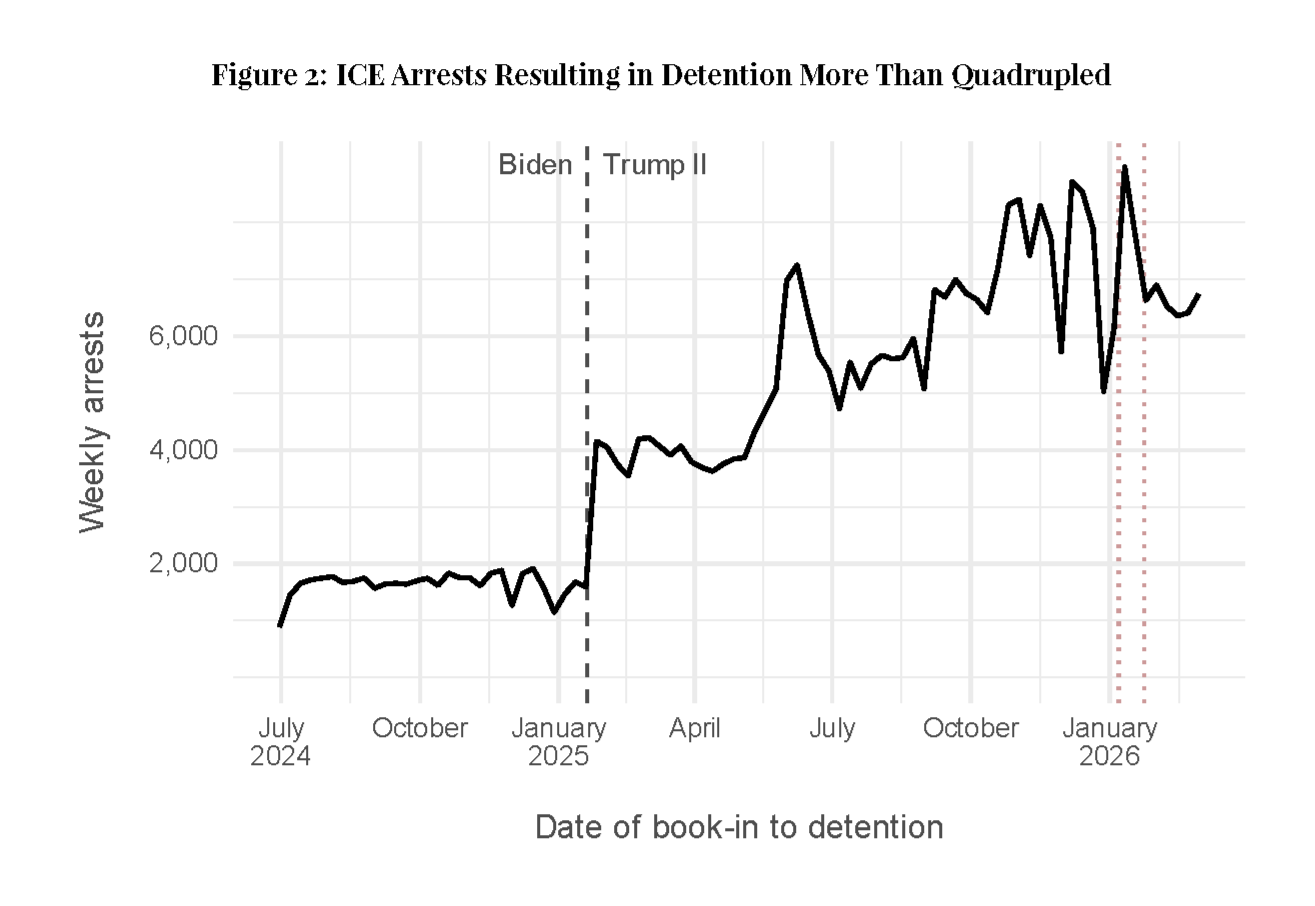
During the first year of the second Trump administration, ICE greatly expanded arrests inside the U.S. Compared with the average month during the second half of 2024, ICE arrests resulting in detention increased approximately 4.4 times by January 2026. The increase was driven largely by a dramatic expansion in street arrests rather than border apprehensions.
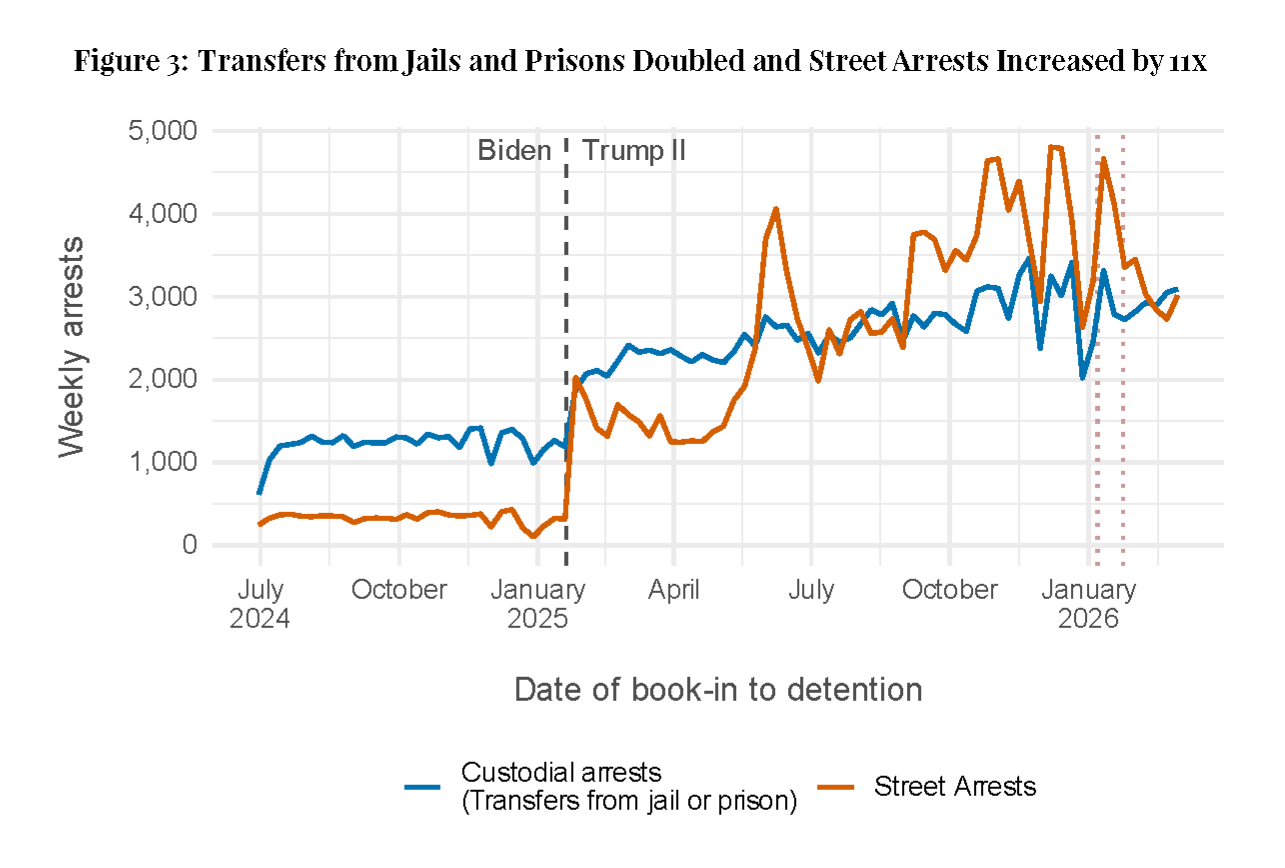
Street arrests increased approximately 11-fold during the study period. These arrests included people encountered in neighborhoods, workplaces, ICE field offices, immigration courts, and other locations across the country. This shift reflects a substantial expansion of interior immigration enforcement as border apprehensions declined, shifting enforcement activity away from the border and into communities nationwide.
Figure 2 shows the rapid growth in ICE arrests resulting in detention over the study period.
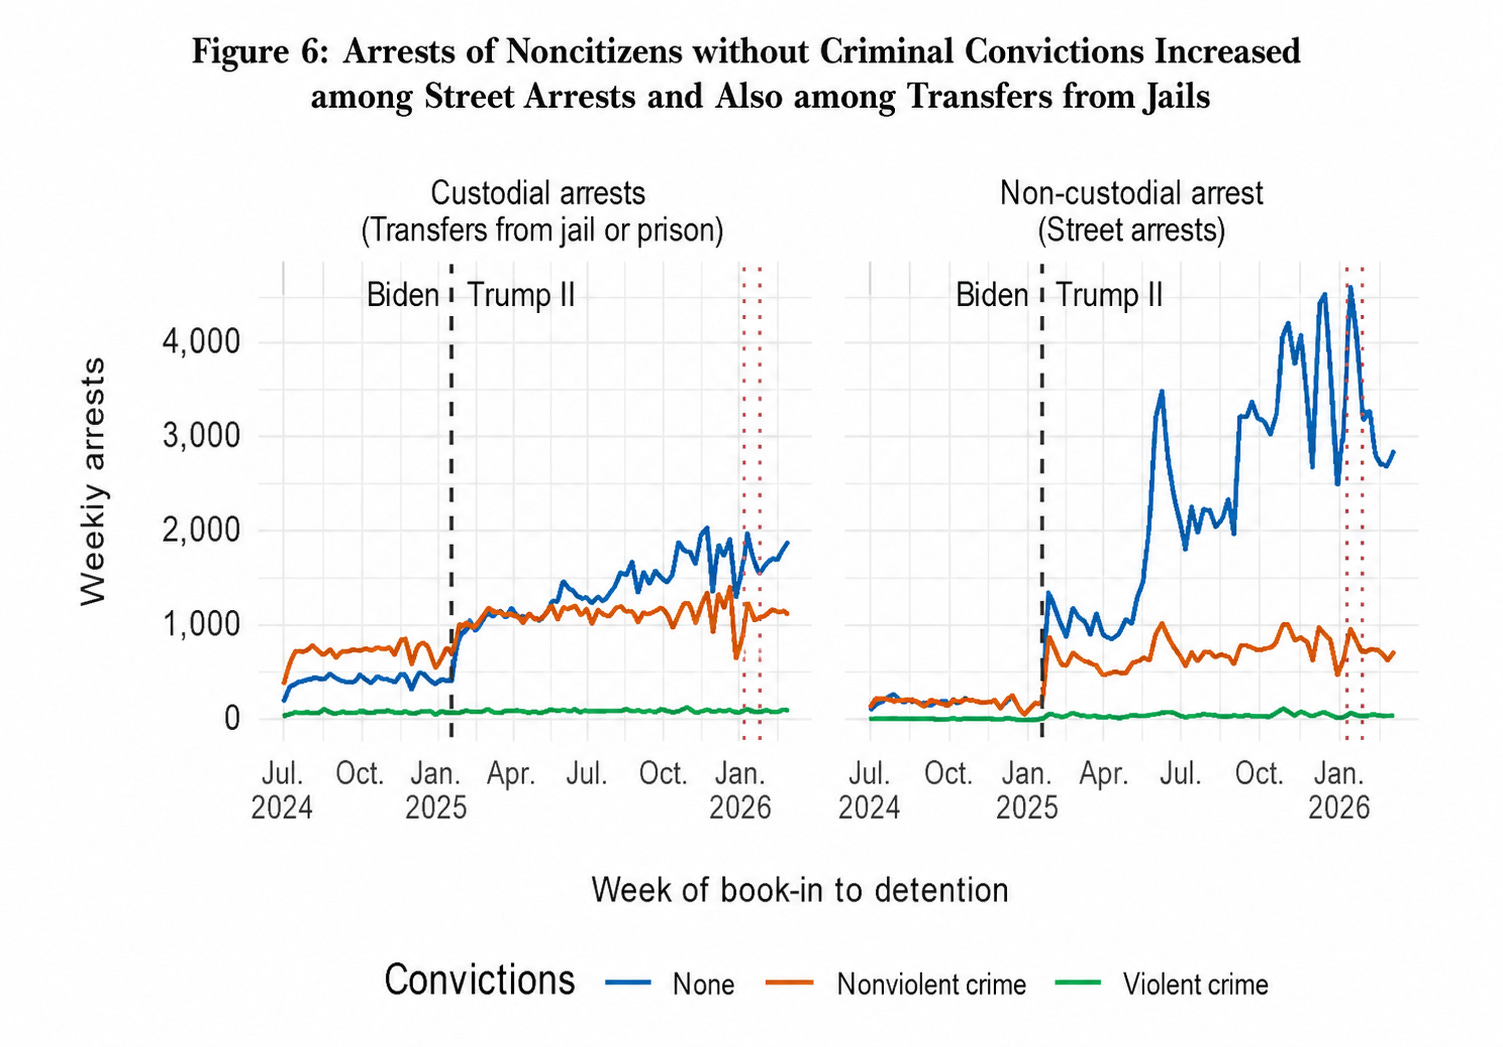
Transfers from local, state, and federal jails more than doubled, but the most dramatic increase occurred in community-based arrests, which rose approximately 11 times. This shift reflects the growing emphasis on enforcement outside correctional facilities.
Figure 3 compares custodial arrests with street arrests, showing that the increase was driven primarily by enforcement in neighborhoods and other community locations rather than transfers from correctional facilities.
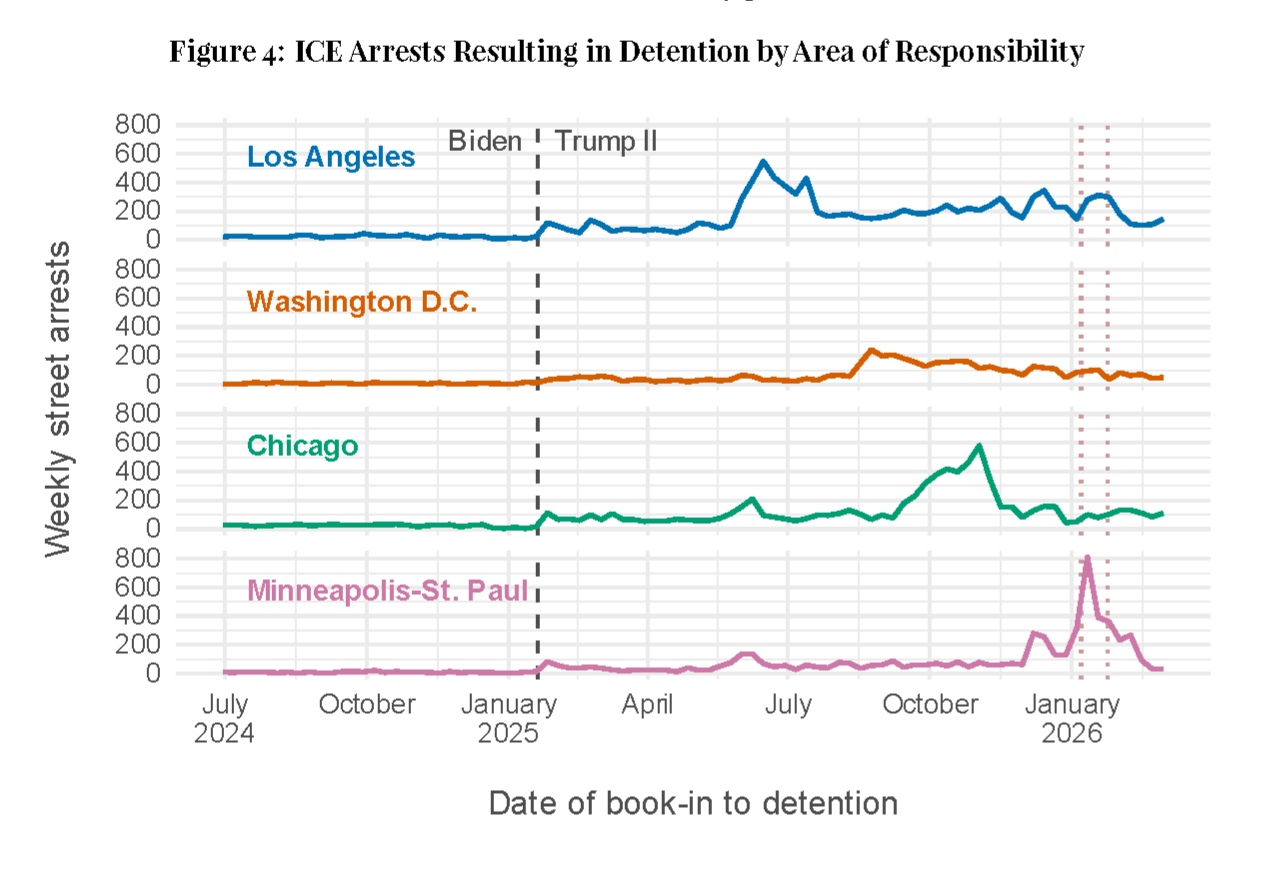
Although enforcement operations in cities such as Los Angeles, Washington, D.C., Chicago, and Minneapolis received significant public attention, increased street enforcement occurred nationwide rather than being limited to a handful of cities.
Figure 4 shows that the increase in street arrests was observed across several geographically distinct ICE areas of responsibility, although the timing and magnitude varied by location.
Arrests of People Without Criminal Convictions
The largest increase occurred among individuals without criminal convictions. Compared with the average month during the second half of 2024, arrests of people without criminal convictions increased 8.7 times by January 2026.
Figure 5 compares arrests by criminal conviction status, showing that the largest increase occurred among people without criminal convictions.
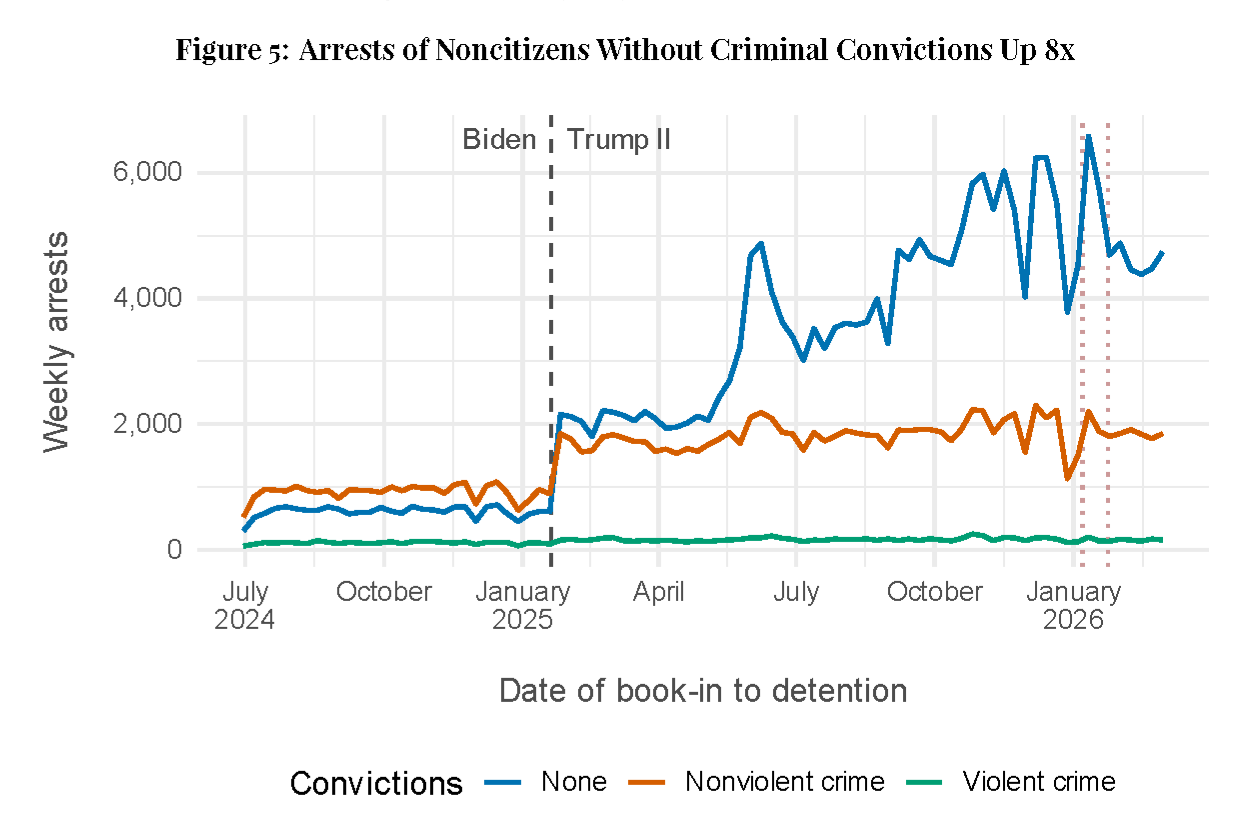
Arrests of individuals with nonviolent convictions roughly doubled, while arrests involving people with violent crime convictions increased approximately 37 percent. As enforcement priorities shifted, a much larger share of immigration arrests involved people who had no criminal conviction.
Figure 6 illustrates how the composition of ICE arrests shifted away from previous enforcement priorities focused on criminal convictions.
More Detentions, Fewer Releases
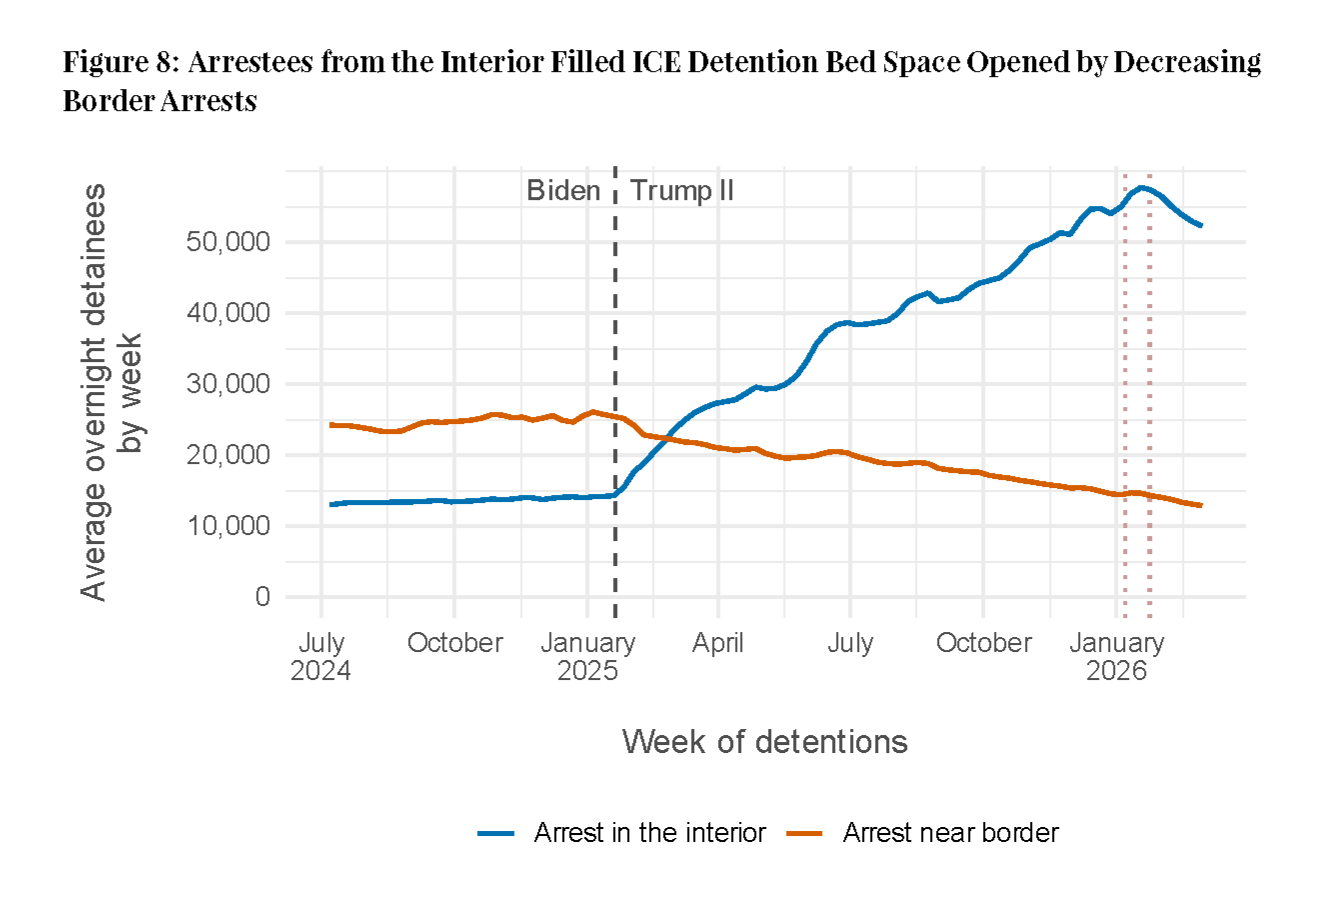
Detention capacity expanded rapidly during 2025. The average number of people held following interior arrests increased from roughly 14,000 to approximately 57,000. Overall ICE detention capacity also grew from about 40,000 beds to approximately 70,000 beds. Less than one-quarter of the additional detention space came from newly opened or reopened facilities. Most of the increase resulted from expanded use of existing capacity.
Figure 7 shows the rapid expansion of detention following interior arrests during the study period.
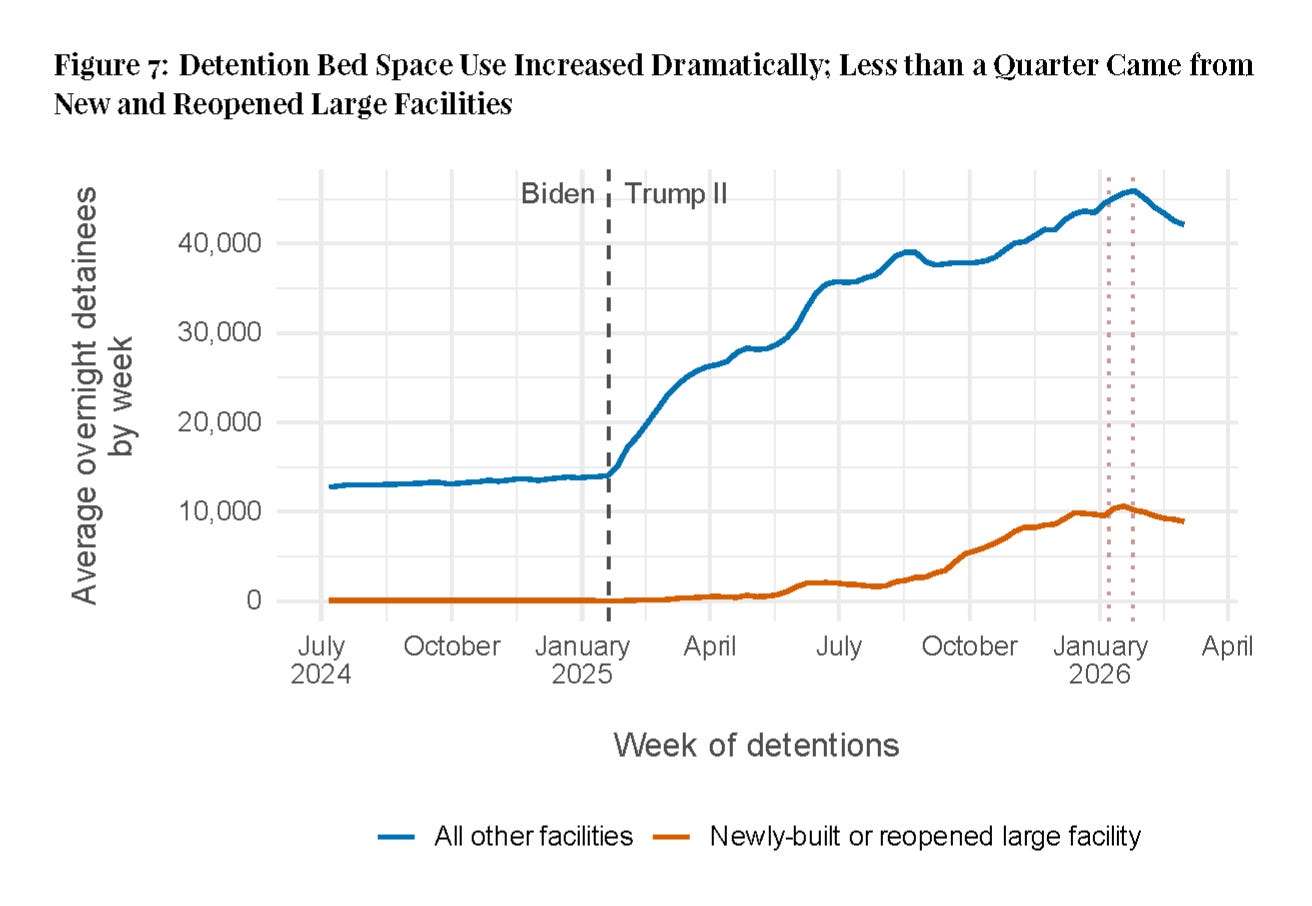
As border apprehensions declined, detention space previously used for border enforcement became available for people arrested within the United States. Additional detention capacity came from newly opened or reopened facilities and expanded use of existing facilities, allowing interior enforcement to grow substantially.
Figure 8 illustrates how declining border apprehensions freed detention capacity for people arrested inside the United States.
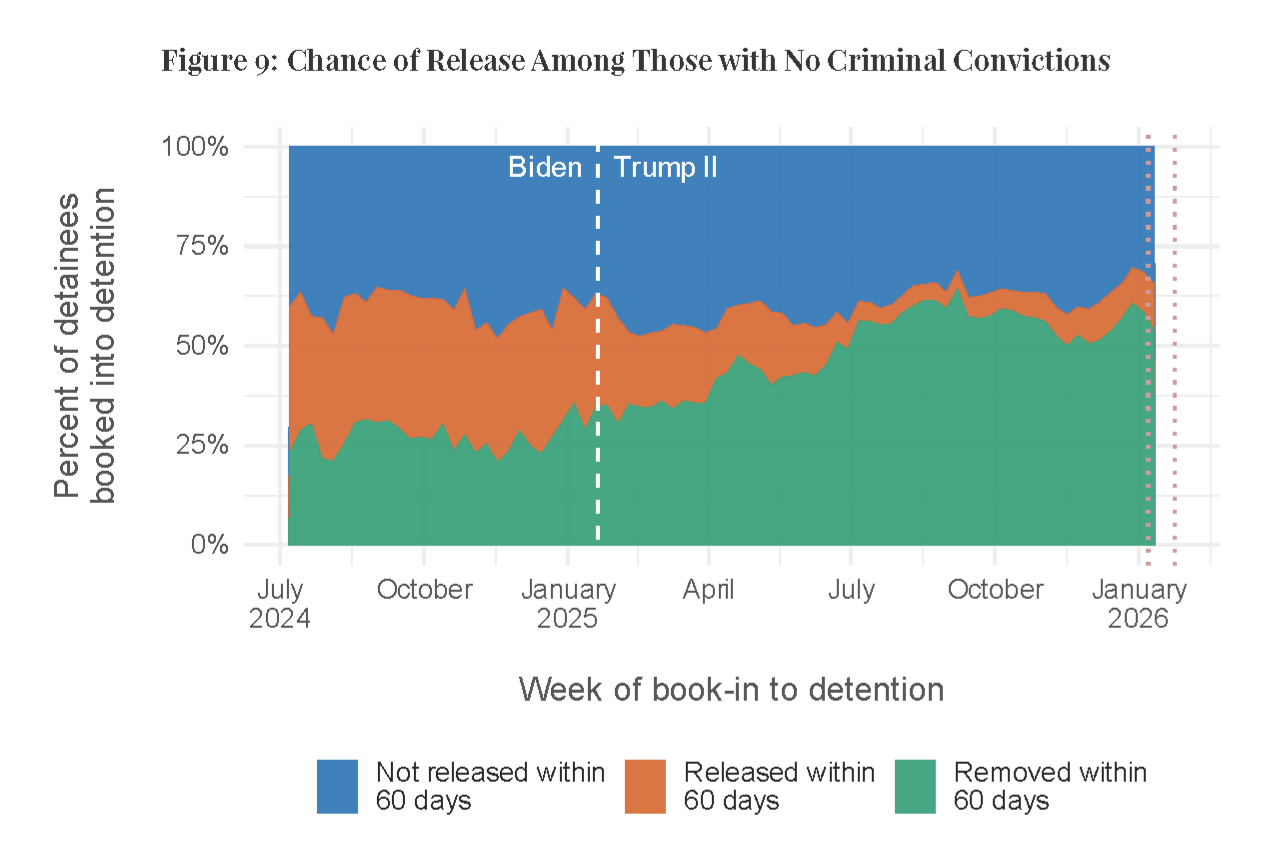
Release from detention became far less common. Overall, release within sixty days declined from 16 percent to 5 percent, while deportation within sixty days increased from 56 percent to 63 percent.
Among people with no criminal convictions and no prior final order of removal, release within sixty days declined from 35 percent to 7 percent, while removal within sixty days increased from approximately 26 percent to 52 percent.
Figure 9 compares detention outcomes, showing that release became far less common while deportations increased.
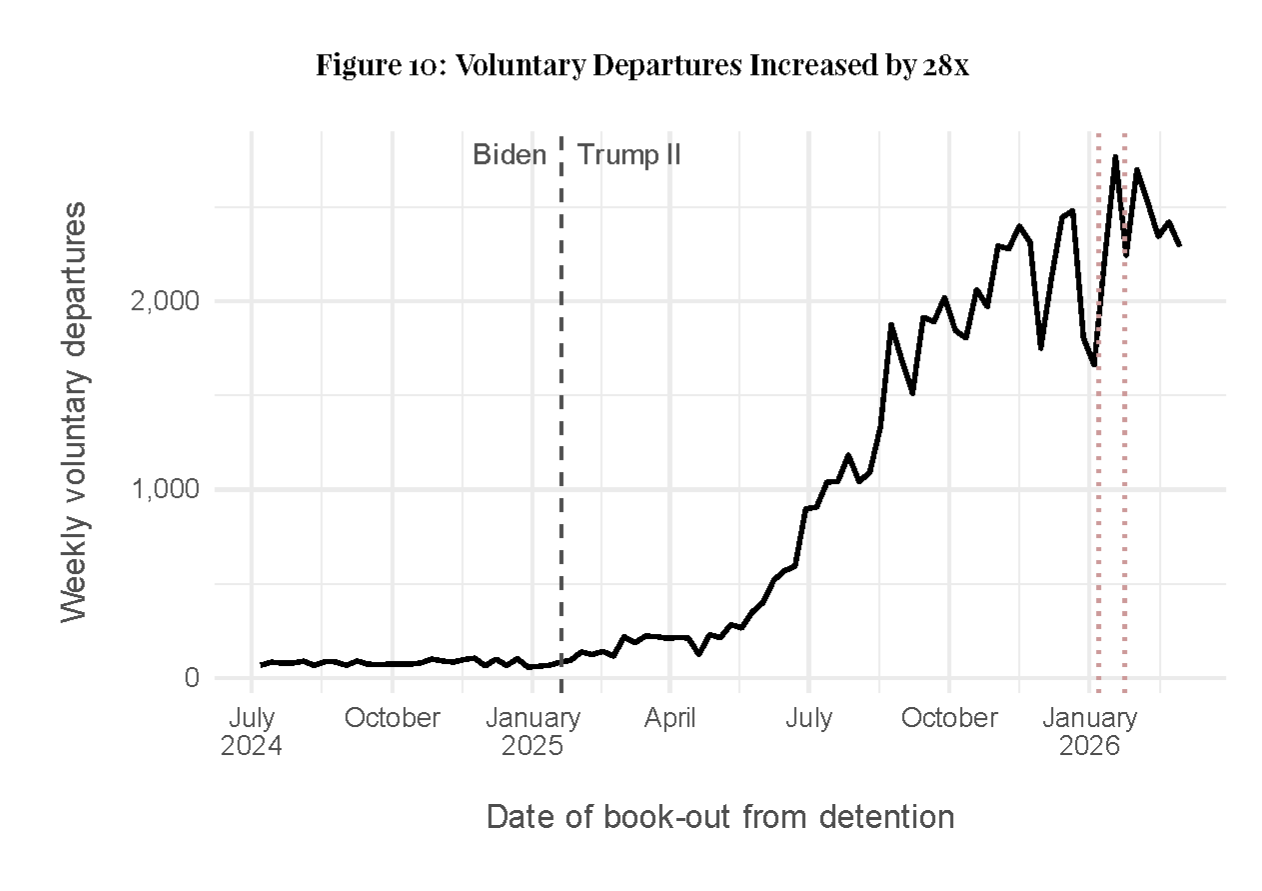
Voluntary departures and voluntary returns increased 28-fold, indicating that many more individuals chose to leave the country while in detention rather than continue immigration proceedings.
Figure 10 shows the dramatic rise in voluntary departures and voluntary returns among people held in ICE detention.
A Brief Decline in Enforcement
Following the killings of Renée Good and Alex Pretti, street arrests declined during February and early March 2026, returning to roughly their September 2025 levels. Despite the decline, interior enforcement remained substantially higher than before January 2025, and the report’s broader findings remained unchanged.
Enforcement Since the Study Period
The Deportation Data Project analyzed immigration enforcement through March 10, 2026. More recent reporting indicates that the administration has continued expanding interior immigration enforcement beyond the period covered by the report.
Subsequent news reports indicate that ICE arrested approximately 10,000 people over a five-day period at the end of June 2026, averaging about 2,000 arrests per day. ABC News also reported that immigration authorities had adopted a goal of at least 2,000 arrests per day. Although these developments fall outside the report’s dataset, they are consistent with the broader trends documented in this article.
Conclusion
During the first year of the second Trump administration, immigration enforcement increasingly shifted from the border to the interior of the United States. Arrests rose dramatically, particularly through street enforcement and arrests of people without criminal convictions. Expanded detention capacity and reduced release rates contributed to a fivefold increase in deportations following ICE arrest and detention. Together, these changes represent a significant shift in the scope and operation of immigration enforcement within the United States.
Coming in Part Two
This report focused on how immigration enforcement changed during the first year of the second Trump administration. Part Two will examine the detention system itself, including where additional detention capacity came from, how facilities expanded, and the role detention plays in supporting increased interior enforcement.
Methodology
The analysis is based on ICE arrest and detention records obtained through the Freedom of Information Act (FOIA). The dataset covers the second half of 2024 through March 10, 2026. Arrest records were matched with detention records to examine trends in arrests, detention, releases, and removals. Custodial and noncustodial arrests were analyzed separately, criminal convictions were categorized using FBI violent-crime classifications, and releases and removals were measured within a consistent sixty-day observation period.
References
Blair, Graeme, and David Hausman. One Year of Immigration Enforcement Under the Second Trump Administration. Deportation Data Project. April 7, 2026. CC0 Public Domain Dedication.
Rebecca Santana. “ICE arrests 10,000 in 5 days, a sharp late-June surge in Trump’s deportation push.” Associated Press. July 2, 2026.
Luke Barr. “ICE arrests 10,000 in US in 5-day span.” ABC News. July 2, 2026.
— Sweeney the Genie
→ Return to the Porch
→ About the Porch Genie
→ Uncork the Bottle